DjangoMaxxing

Serving thousands of OpenTelemetry requests per second in one process

Paris Kasidiaris · Django Day Denmark 2026

djangomaxxing

/ˈdʒæŋɡoʊ ˈmæksɪŋ/ verb, informal

  1. To do the most possible things with Django.
  2. To utilise Django to the greatest possible extent.

"We DjangoMaxxed it. We built a single-process OTEL server with Turso."

how it started

Message from Antonis Kalipetis, 13 August 2026: I think we should remove Sentry from the PR environments because it eats all of our quota.

fakos

one process. one asyncio loop. no threadpool. no database server.

thousands of opentelemetry requests per second.

opentelemetry primer

  • an open standard for telemetry
  • three signals: logs, metrics, traces (profiles in alpha)
  • transported via protobuf over http or grpc

what fakos does

  • ingests opentelemetry requests with raw data into a table
  • projects raw opentelemetry data into relational tables
  • queries data in relational tables

constraints

  • django 6.1 over python 3.14
  • 1 process with 1 python thread
  • django orm only (no raw sql) with sqlite via turso
  • status 200 means durable on disk

1,000+ req/s

this is our performance gate

numbers

scenario result
mixed ingestion of logs + metrics + traces, 5 minutes 1,100 req/s, 0 failures
ingestion of logs only, 1 record per request, peak 2,395 req/s, p99 24 ms
ingestion of logs only, 10 records per request, peak 1,536 req/s, p99 97 ms
ingestion of logs only, 10 records, 10 clients p50 4.5 ms, p99 32 ms
search in logs by service, 3.2 million logs median 24.9 ms
trace detail (161,051 spans) during 1,100 req/s ingestion p99 43 ms

macbook air m1 · docker desktop · load tester on the same host

our approach

our approach

  • minimise components, then optimise
  • remove the biggest bottleneck at a time
  • keep what gives a great user experience

the elephant in the room

asyncio is not a speed-up

  • cpu is still blocking
  • nothing becomes faster
  • neither django nor sqlite are async

we had to change a few things

asyncio native database driver

  • we built a native turso async database driver
  • we patched pyturso for end-to-end single threaded io_uring
  • we fixed bugs in turso appearing after load

asyncio django orm

we built async single-threaded orm primitives without sync_to_async:

  • AsyncManager
  • AsyncQueryset
  • AsyncConnection
  • AsyncCursor

the price: no joins or select_related (for now)

one thread everywhere

we rebuilt for single-threaded asyncio:

  • auth
  • sessions
  • middleware

architecture

the request path

OTLP client your app Root uvicorn · 1 loop Ingestion raw ASGI Queue bounded Writer one coroutine SQLite Turso engine /v1/logs · /v1/metrics · /v1/traces Django ASGIHandler dashboard, admin, login reads

root is one match statement

async def __call__(self, scope, receive, send):
    match scope.get("type"):
        case "lifespan":
            await self.lifespan(receive, send)
        case "http" if self.is_ingest(scope):
            await self.ingest(scope, receive, send)
        case "http":
            await self.django(scope, receive, send)


def is_ingest(scope):
    otel_default_paths = {"/v1/logs", "/v1/metrics", "/v1/traces"}
    return scope.get("path", "") in otel_default_paths

ingestion out of django request stack

  • middlewares cost
  • we need no sessions, templates, csrf, etc.
  • all we need; parse request body, enqueue and store

ingestion: decode, enqueue, wait

body = await decode(receive)               # 400 if it is not valid OTLP
committed = loop.create_future()

if not enqueue(body, committed):           # the queue is full
    return await respond(503)              # the client retries later

await committed                            # the writer resolves it
return await respond(200)                  # raw data stored on disk

enqueue: admit or say no

def enqueue(self, request):
    if self.closed or self.is_full(request):   # items and bytes are bounded
        return False                           # the caller answers 503
    self.waiting.append(request)
    self.wake_writer()                         # the writer sleeps until this
    return True                                # never waits for room

a request is admitted at once or rejected at once. Nothing waits in line for space.

the writer

one coroutine. One connection.

one writer, on purpose

  • one coroutine on the same event loop owns the database connection
  • no threads, no sync_to_async
  • requests wait on a future, the writer resolves it after the commit

never wait for more work

  • the writer takes only what is already queued
  • under load the group grows by itself
  • latency stays low, throughput rises with load

storage

asyncio sqlite, via turso

what is under the orm

  • bespoke django database backend: django_turso
  • io_uring for asynchronous file i/o
  • parquet blobs for metrics

a normal django database setting

DATABASES = {
    "fakos": {
        "ENGINE": "django_turso.db.backends.turso",
        "NAME": FAKOS.data / "fakos.db",
        "OPTIONS": STORE_OPTIONS,
        "CONN_MAX_AGE": None,
    },
}

an async aggregate

bounds = await Span.objects.filter(trace_id=trace_id).aaggregate(
    first=Min("start_ts"),
    last=Max("end_ts"),
)

Where does a trace of multiple spans start and end?

a group-by, awaited

recent = (
    MetricPoint.objects
    .filter(series_id__in=series_ids, time_unix_nano__gte=since)
    .values("series_id")
    .annotate(recent_count=Count("id"))
)
counts = {
    row["series_id"]: row["recent_count"]
    async for row in recent.aiterator()
}

How many points did each metric report recently?

a sqlite glob query

services = (
    Service.objects
    .filter(name_key__glob="*ceryx*")
    .order_by("-last_seen")
)
async for service in services.aiterator():
    ...

glob is a lookup we added to Django SQLite-compatible backends.

things will go wrong

when it goes wrong

  • a full queue says 503, fast
  • a slow commit is flagged, not killed
  • kill it mid-load: no acked request lost

what got us to 1,000 requests

what got us to 1,000 requests

  • reduce cpu per request: two caches, no __init__
  • store now, think later: ack the raw request, project after
  • commit grouping: one commit and one insert per batch

reduce cpu per request

  • resolve, cache and update services once per batch: +18% req/s
  • cache insert shape and fill-in values: +9% req/s
  • skip __init__: −71% construction cost

skip __init__

construction cost in the profile: 0.216 s → 0.063 s (−71%)

@classmethod
def fast_init(cls, fields, values):
    instance = object.__new__(cls)
    for field in fields:
        instance.__dict__[field.attname] = field_value(field, values)
    instance._state = ModelState()
    return instance

store now, think later

  • the 200 waits only for the raw request to be committed
  • logs, metrics and traces rows are projected after the 200, in small slices
  • the cost of an ack no longer grows with the records in a request

commit grouping

take up to 32 waiting requests (never wait for more):

  • 10 clients: 726 → 1,081 req/s
  • 20 clients: 678 → 1,219 req/s
  • 80 clients: 416 → 1,535 req/s

a synchronous=FULL commit costs 0.8 ms (~1,260/s)

group commit, drawn

R1 waits on a future R2 waits on a future R3 waits on a future R4 waits on a future writer: one batch commit one fsync, all four 1. requests queue up while a commit runs 2. the writer takes the whole batch 3. one commit makes all of it durable 4. it resolves every future, each client gets its own 200 request in 200 back

one transaction, one bulk insert: +15% req/s (two runs)

async def store_raw(self, batch):
    raw_requests = [
        RawRequest.fast_init(**request)
        for request in batch
    ]
    async with self.database.atransaction():
        await RawRequest.objects.abulk_create(
            raw_requests,
            ignore_conflicts=True,
        )

asyncio win

  • zero sync_to_async hops
  • one thread for ingest and dashboard

one asyncio catch: bounds

  • an unbounded long-running job stalls everything
  • a limit turns a stall into a fast no
  • every queue, wait and read needs one

demo time

flex time

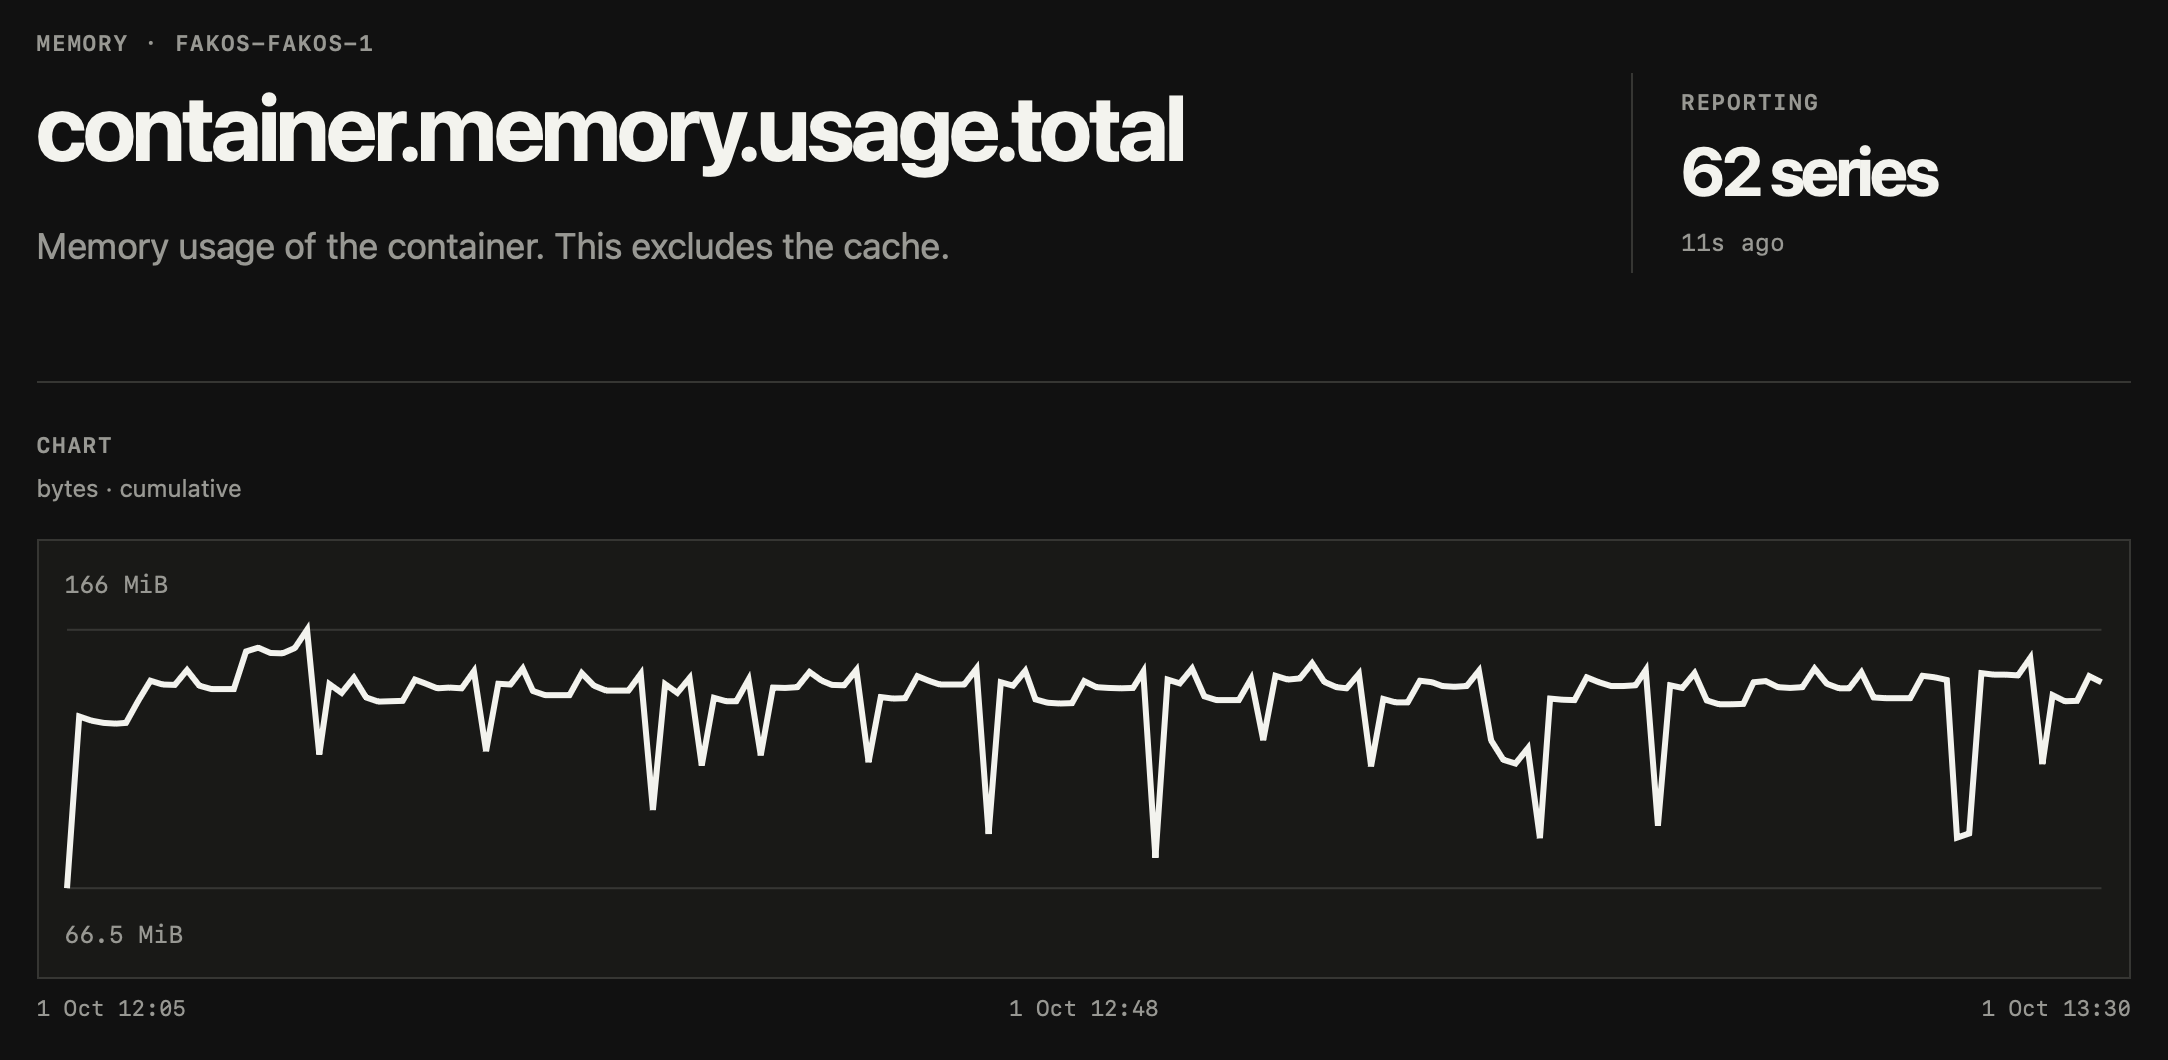
memory usage: from 66.5 MiB to 166 MiB

Chart of container.memory.usage.total for the fakos container from 1 Oct 12:05 to 13:30. Memory rises to its working level in the first minutes, then stays flat with short dips. The peak is 166 MiB.

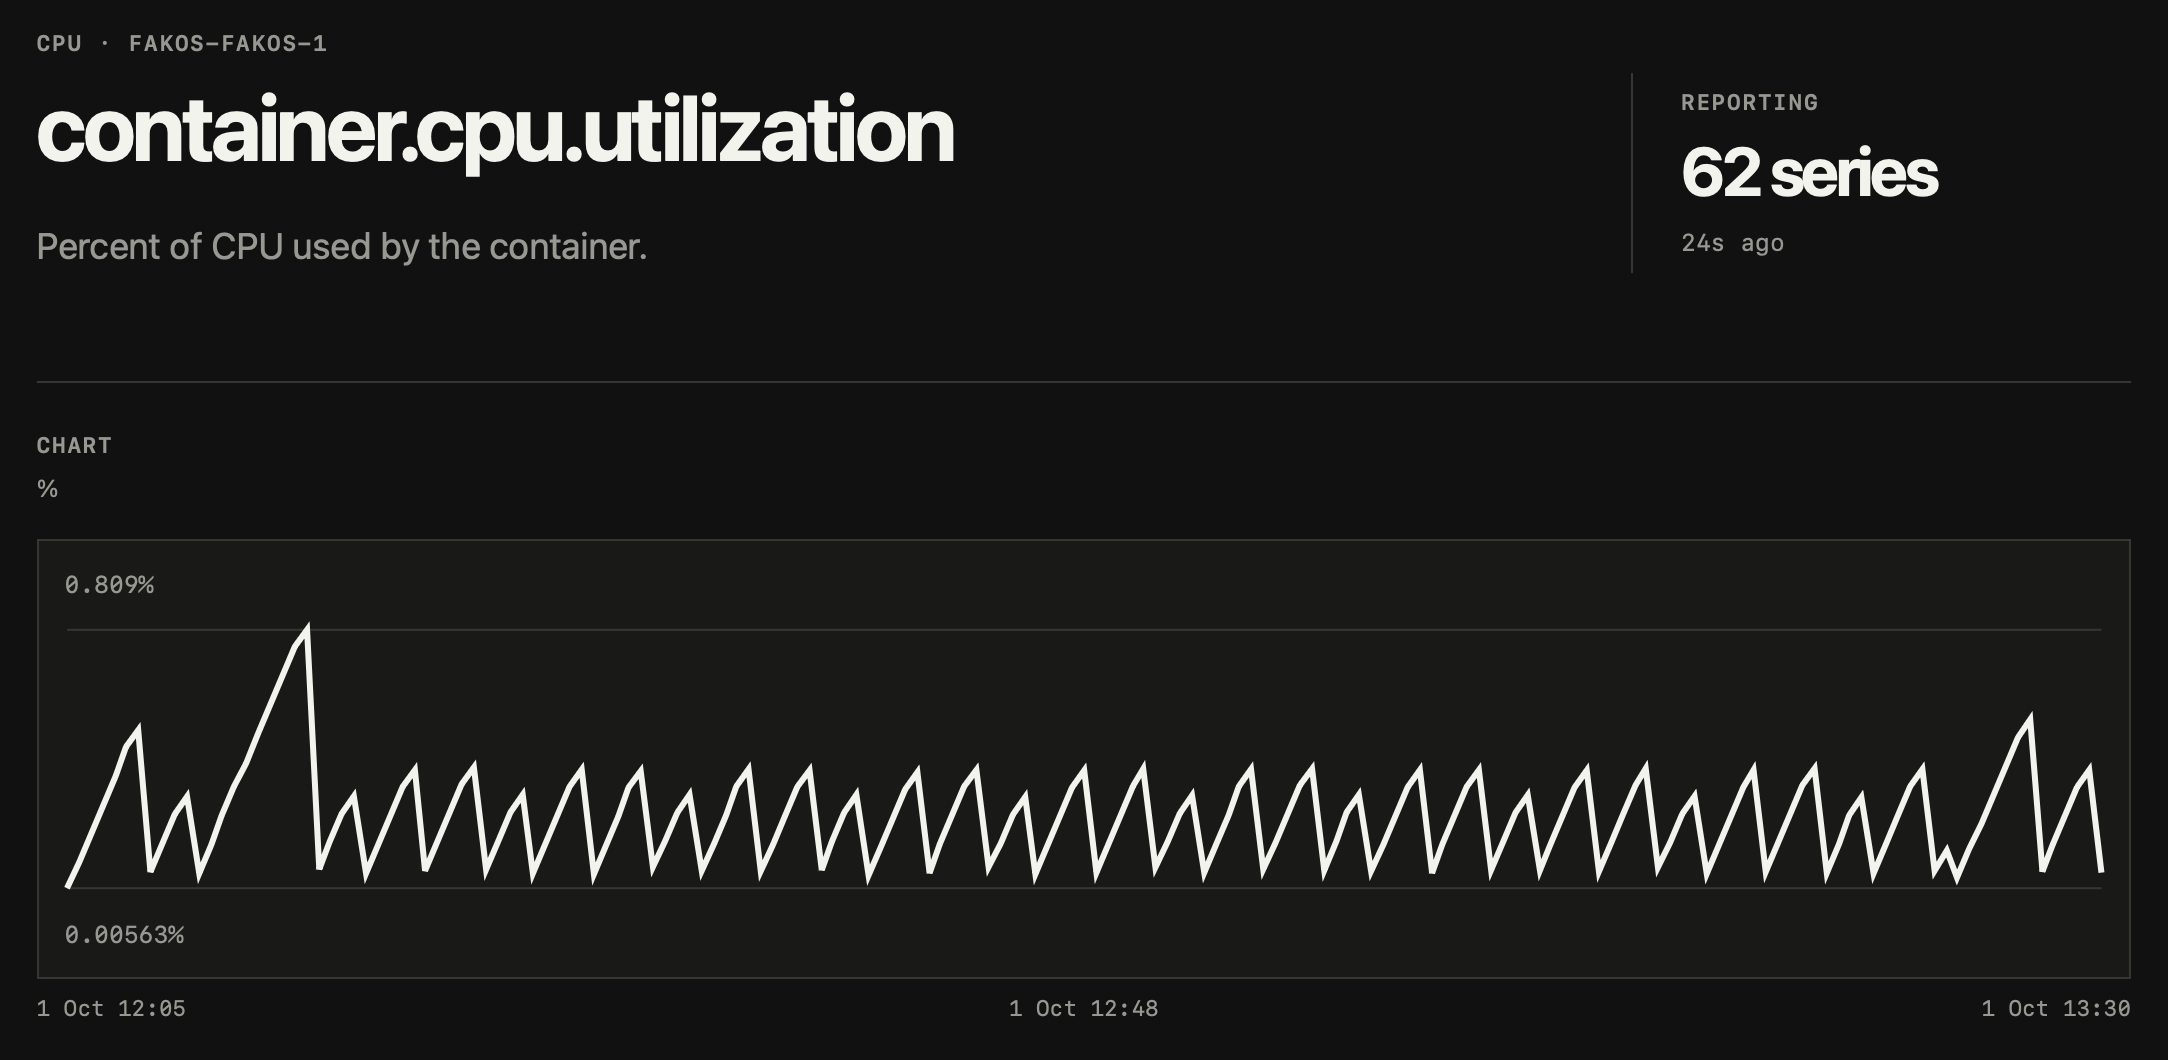
cpu utilization: from 0.00563% to 0.809%

Chart of container.cpu.utilization for the fakos container from 1 Oct 12:05 to 13:30. A regular sawtooth that stays below 0.81 percent.

take aways

  • nothing is magic, you can approach everything
  • developer experience and taste is critical
  • django is extremely capable; from garage to IPO

open source

  • turso upstream fixes
  • dj11 superpackage including; aorm, django_glob and sse
  • django_turso
  • deucalion git-aware load testing
  • fakos core

what's next

  • retention management
  • synthetic metrics (e.g. p99 latency)
  • parquet-native orm queries (points.annotate(p99=PointQuantile(0.99)))
  • alerts
  • 10,000+ requests per second

fakos.dev

Join for early preview 12 Oct 2026

Thank you.